
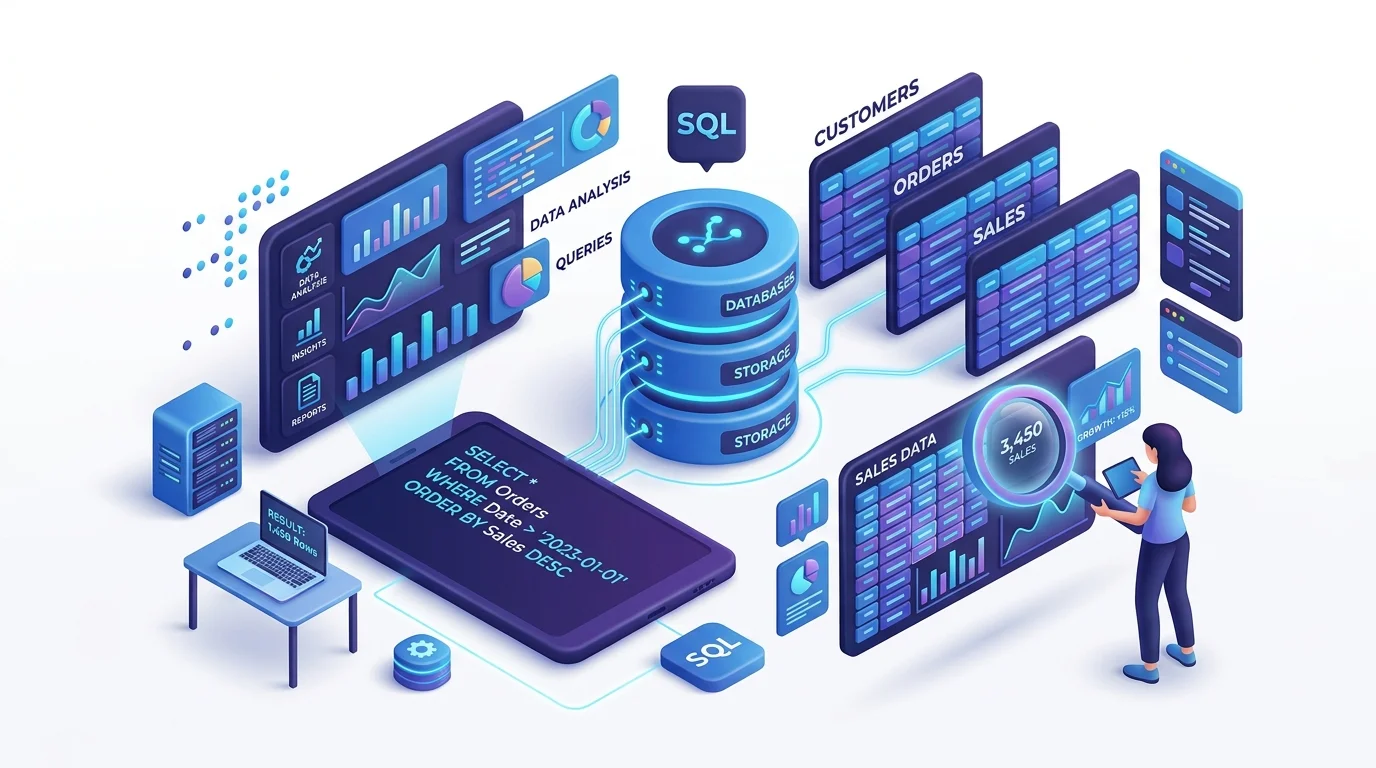
SQL (Structured Query Language) is the single most important technical skill for data analysts. It enables you to extract, filter, aggregate, and transform data directly from relational databases — without depending on engineering teams to export data for you.
Whether you are an absolute beginner or a professional looking to sharpen your data querying skills, this guide walks you through SQL fundamentals, key query concepts, and real-world applications used by data analysts every day.
Why SQL is the #1 Skill for Data Analysts
SQL is required in over 80% of data analyst job postings in India. Here is why it is indispensable:
Query data directly from enterprise databases without waiting for ETL exports.
SQL works across PostgreSQL, MySQL, BigQuery, Snowflake, SQL Server, and more.
Extract, filter, and aggregate millions of rows in seconds with a single query.
SQL Fundamentals Every Analyst Must Know
Start with these core clauses, which form the foundation of almost every SQL query you will ever write:
SELECTSpecifies which columns to retrieve from the database.
FROMSpecifies which table (or tables) to query.
WHEREFilters rows based on a condition (e.g., WHERE country = 'India').
GROUP BYGroups rows sharing a property so aggregate functions can be applied.
ORDER BYSorts the result set by one or more columns, ascending or descending.
LIMITRestricts the number of rows returned — useful for previewing large tables.
HAVINGFilters grouped results (like WHERE, but applied after GROUP BY).
Writing Your First SQL Queries
The most fundamental SQL query retrieves data from a single table. Here is a typical example an analyst might write to find top-performing products:
Reading this query from top to bottom: we are selecting the product name, total revenue, and order count from the orders table, filtering for Q3 2026 dates, grouping the results by product, sorting by revenue (highest first), and capping the output at 10 rows.
JOINs, Aggregations & Subqueries Explained
Real business data is stored across multiple related tables. JOINs let you combine them into a single result set.
INNER JOINReturns only rows that have matching values in both tables. Use this when you need records that exist in both tables (e.g., customers who placed at least one order).
LEFT JOINReturns all rows from the left table and matching rows from the right table. Non-matching right rows return NULL. Use this when you want all records from the primary table regardless of whether a match exists (e.g., all customers including those without orders).
RIGHT JOINReturns all rows from the right table and matching rows from the left table. Rarely used — a LEFT JOIN with tables swapped achieves the same result more readably.
FULL OUTER JOINReturns all rows from both tables. Rows that don't match appear with NULL values for the non-matching side. Useful for finding discrepancies between two datasets.
📊 Aggregate Functions to Master: SUM(), COUNT(), AVG(), MIN(), MAX() — these are the building blocks of almost every analytical query you write in your day-to-day work.
How Data Analysts Use SQL in Real Workflows
Here are typical SQL tasks that data analysts perform every week at growing companies:
Group customers by purchase frequency, average order value, or geographic location to target marketing campaigns.
Track where users drop off in a sign-up or checkout funnel by counting transitions between step events.
Group users by their acquisition date to compare retention curves and identify the most valuable user cohorts.
Aggregate daily, weekly, or monthly revenue by product, region, or sales team for executive dashboards.
Compare conversion rates between control and experiment groups to evaluate the statistical significance of product changes.
Identify missing values, duplicates, and anomalies in operational datasets before delivering reports to stakeholders.
A Structured SQL Learning Path for Beginners
Follow this progressive learning path to go from zero to job-ready SQL proficiency:
Learn SELECT, FROM, WHERE, ORDER BY, LIMIT. Practice on a sample database using SQLZoo or PostgreSQL locally.
Master GROUP BY, HAVING, and the five core aggregate functions. Write queries that summarise real business datasets.
Understand INNER, LEFT, RIGHT, and FULL JOINs. Practice combining customer, order, and product tables.
Write nested subqueries and Common Table Expressions (CTEs) to build more readable, modular query logic.
Learn RANK(), ROW_NUMBER(), LAG(), LEAD() and apply them to real analytical problems. Build a portfolio project.
🚀 Learn SQL with Mentors: The AcceleratorX Data Analytics Program teaches SQL as part of a comprehensive, mentor-led curriculum with real industry datasets and placement support.
Frequently Asked Questions
Start Practising SQL Today
SQL is the most direct path to becoming a productive data analyst. Its syntax is readable, its applications are universal, and proficiency can be achieved within weeks of disciplined practice.
Open a free SQL editor, find a public dataset, and write your first query today. Each query you write builds the intuition that separates confident analysts from those still waiting for data to be sent to them.
Learn SQL, Power BI, Python, and Excel with real industry datasets, live mentorship, and placement support at AcceleratorX.
Enrol in the Data Analytics Course