
Data analytics is an essential skill for businesses across all industries. Companies use data to understand customer behaviour, improve operations, spot market trends, measure performance, and make data-driven business decisions. As organisations produce ever greater quantities of data, the need for professionals who can understand, analyse, and communicate it effectively is increasing.
Artificial Intelligence (AI) is also changing how analysts work with data. AI-driven tools can help with repetitive tasks, data exploration, formula creation, SQL queries, coding, visualisation, reporting, and insight generation. Yet human understanding is still necessary for effective data analytics. Analysts must know how the data is collected, how it should be analysed, whether the results are accurate, and how they relate to business objectives.
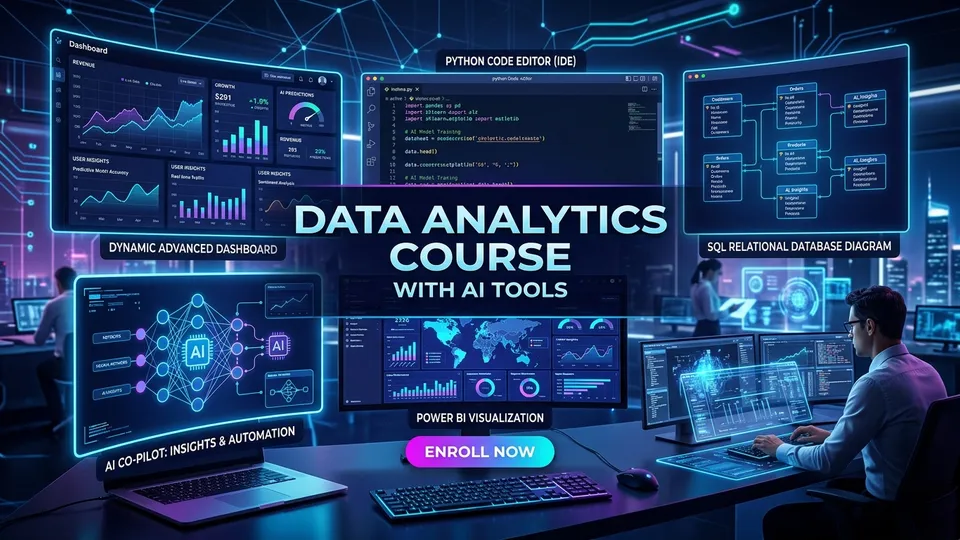
This data analytics course uses AI tools to combine traditional data analytics concepts with modern, AI-assisted technologies. Students can gain practical skills in Excel, SQL, Power BI, Python, data visualisation, and AI-assisted analytics workflows.
This combination helps students and working professionals gain an end-to-end understanding of data analytics while learning how AI can boost productivity and support analytical decision-making in day-to-day work.
1. What Does a Data Analytics Course Involving AI Tools Consist of?
A data analytics course with AI tools is a structured learning programme that teaches the basic principles of data analytics alongside the practical uses of artificial intelligence so that learners can apply both skills together.
Traditional data analytics includes several stages, such as gathering data, cleaning datasets, organising information, analysing patterns, producing visualisations, and communicating results. A contemporary analytics course can show learners how to carry out these tasks using commonly used business and analytics tools.
Students can learn a range of technologies, including Microsoft Excel, SQL, Power BI, Python, and AI-powered analytics tools; in some cases, they will also work with real-world datasets and business scenarios.
AI can assist with many stages of the analytics process. For instance, an assistant can help explain Excel formulas, analyse a dataset, produce preliminary SQL queries, and summarise patterns found in a report, saving time on routine work. Before using it to make business decisions, an analyst should check that the result is suitable.
A course that combines the fundamentals of analytics with artificial intelligence can therefore help learners understand both the technical tools and the analytical thinking needed when working with data.
2. What Is There to Gain From Learning Data Analytics Using AI?
Businesses use data in many activities. For example, marketing teams review campaign results, finance teams examine revenue and expenses, sales teams monitor customer activity, and operations teams review processes and performance to guide action.
Traditional data analysis often includes many time-consuming tasks, and AI tools can help with some of them, letting analysts focus more on interpreting results, answering business questions, and adding value.
Some key benefits of learning data analytics with AI include:
For instance, an analyst working with a large sales dataset might use conventional tools to filter, sort, calculate, and visualise the data. At the same time, an AI assistant could explain how a specific calculation works or provide a starting point for a query or analysis, helping the analyst move faster.
Human Review Is Crucial: Yet AI does not eliminate the need for analytical knowledge; the analyst must verify that the data is accurate, the chosen methodology is suitable, and the available evidence supports the conclusions. Learning analytics and AI will help people know when AI assistance is useful and when human review is needed so that they can work more confidently and effectively.
3. What Will You Acquire in a Data Analytics Course?
A data analytics course that includes AI tools can cover a range of technical and practical topics. Although the specific curriculum may differ from one programme to another, the subjects listed below form a solid basis for building job-ready skills.
1. Excel for Data Analytics
Microsoft Excel remains widely used to organise, analyse, and report data, especially by business teams working with spreadsheets and structured datasets. Learners can study:
AI tools can offer extra help with Excel; for instance, learners can use AI to work out a complicated formula, fix an error, or explore different ways to analyse a dataset. However, learners need to understand a formula's function and check that it produces the expected result.
2. SQL (Structured Query Language)
SQL is a valuable skill for working with relational databases. Data analysts use it to retrieve and analyse information, answering business questions from raw tables:
AI tools can turn natural-language prompts into initial SQL queries. Analysts must learn SQL fundamentals to verify whether the query accurately answers the business question.
3. Power BI for Business Intelligence
Power BI is commonly used for business intelligence, reporting, and interactive data visualisation, turning data into actionable insights:
AI-powered features help explore datasets and spot trends, while analysts decide what information is relevant and visually authentic.
4. Python for Data Analytics & Automation
Python is widely used for data processing, analysis, automation, and handling large or repeatable analytical tasks. Courses introduce libraries such as Pandas and NumPy alongside basic visualization techniques:
AI assistants help learners understand Python syntax and resolve bugs, but learners must understand the underlying logic to prevent hard-to-detect errors.
5. Data Visualisation & Visual Storytelling
Data visualisation is essential because analytical results must be communicated clearly to non-technical stakeholders:
Learners discover how poor chart choices can distort data and how to apply colour psychology, hierarchy, and context to tell persuasive data stories.
6. Tools Based on AI for Data Analytics
AI tools support analysts across every phase of the project lifecycle:
- Explaining unseen datasets and exploring column distributions
- Creating and explaining complex formulas across Excel and DAX
- Generating SQL queries from natural-language prompts
- Assisting with Python scripting, data wrangling, and error resolution
- Summarising dense analytical reports into clear takeaways
- Identifying possible anomalies, correlations, and outliers
- Generating sharp hypotheses and analytical questions
- Drafting initial project analysis roadmaps
- Explaining technical data science concepts simply
- Automating repetitive data reporting tasks
Learners use AI as a high-powered analysis assistant while maintaining full control and validation over the final business conclusion.
Looking for a structured, mentor-led program?
Check out the AcceleratorX Data Analytics Course featuring live classes, IBM co-certification, portfolio projects, and 1:1 placement assistance.
4. What Kind of People Can Enrol in a Data Analytics Course That Uses AI Tools?
A course in data analytics using AI tools suits learners from diverse academic and professional backgrounds:
Most courses that include AI tools are designed for complete beginners, meaning no prior experience in programming is required unless specified. The curriculum begins with Excel and foundational concepts before progressing to SQL, Power BI, Python, and AI-assisted workflows.
5. Career Opportunities After Learning Data Analytics
Data analytics skills open doors to numerous business and technology roles across industries:
Data Analyst
Gathers, processes, and analyses data to answer pressing business questions, building dashboards that help teams make informed decisions.
Business Analyst
Evaluates business requirements, processes, and KPIs to support strategic decision-making and drive operational improvement.
Business Intelligence (BI) Analyst
Develops and maintains dynamic BI dashboards, data models, and performance trackers to give leadership clear visibility into operations.
Reporting Analyst
Produces regular management reports and operational summaries that help functional teams monitor KPIs and take swift corrective action.
Marketing Analyst
Examines digital marketing campaign performance, customer acquisition costs (CAC), conversion funnels, and ROI metrics to optimize spend.
Operations Analyst
Uses operational datasets to examine logistics, inventory turnover, costs, and process cycle times to boost productivity and eliminate bottlenecks.
Junior Data Scientist
Applies foundational statistical learning, Python scripting, and machine learning models to build predictive forecasting systems.
Data Visualisation Analyst
Specializes in converting multi-dimensional data into clear, interactive visual dashboards and infographics for executive leadership.
Practical portfolio experience is key when applying for these positions. Documenting your analytical methods, building clean dashboards, and explaining your business impact on GitHub and LinkedIn can effectively demonstrate your capability to hiring managers.
6. Practical Projects You Can Build
Practical projects let learners apply what they have learned to real-world business situations and build a portfolio for future roles:
Customer Analysis Project
RFM (Recency, Frequency, Monetary) customer segmentation and cohort retention analysis.
E-Commerce Analytics Dashboard
End-to-end sales, conversion rate, and inventory performance tracking in Power BI.
Marketing Campaign Analysis
Multi-channel attribution modeling and ROAS tracking across Google and Meta ads.
Financial Data Analysis
Revenue variance analysis, P&L reporting, and operating margin forecasting in Excel.
Employee Performance Dashboard
HR analytics dashboard monitoring attrition rates, satisfaction scores, and hiring metrics.
Product Sales Forecasting
Time-series sales forecasting using Python statistical modeling and machine learning.
Customer Segmentation Project
Clustering customer profiles in Python to identify high-value purchasing segments.
Business Performance Report
Executive KPI scorecards and automated weekly operational digests.
Inventory Analysis Dashboard
Supply chain stock-out monitoring and safety stock optimization models.
AI tools can be used to help formulate queries, write Python functions, document schemas, and draft executive summaries, while you maintain full verification over the results.
7. How AI Is Changing Data Analytics
AI is automating routine, manual tasks across the analytics lifecycle, freeing up analysts to spend more time interpreting insights and solving complex business problems.
Natural-language querying allows non-technical users to investigate data faster, while AI copilots help experienced analysts write complex SQL queries, debug scripts, and summarize multi-page reports in seconds.
Essential AI Validation Checklist for Modern Analysts
- Check SQL queries: Verify table joins, aggregation logic, and edge conditions against schema rules.
- Review generated code: Confirm that Python functions handle null values and data types properly.
- Validate analytical conclusions: Cross-check AI-generated findings against underlying raw datasets.
- Protect confidential information: Ensure proprietary business data complies with privacy standards.
- Identify data-quality issues: Spot sampling bias, missing records, or outliers before running models.
- Understand AI limitations: Recognise that AI cannot substitute for strategic domain intuition.
8. Skills You Can Develop Through the Course
A comprehensive course develops a balanced combination of technical mastery, analytical reasoning, and practical problem-solving:
Technical Skills
- Microsoft Excel & Power Query
- Advanced SQL Querying
- Power BI & DAX Modelling
- Python (Pandas, NumPy)
- Data Cleaning & ETL
- Interactive Visualisation
- AI-Assisted Analytics Tools
Analytical Skills
- Understanding Business Questions
- Exploratory Data Analysis
- Pattern & Anomaly Detection
- Comparative Performance Analysis
- Statistical Interpretation
- Data Storytelling & Reporting
- AI Output Validation
Problem-Solving
- Selecting Relevant Datasets
- Choosing Optimal Methodologies
- Synthesizing Complex Insights
- Executive Decision Support
- Cross-Functional Collaboration
- Questioning Anomalous Data
- Actionable Business Strategy
Want to compare course syllabi, fees, and career roadmaps across top Indian institutes? Read our companion guide on AI Data Analytics Course in India.
9. How to Choose a Data Analytics Course with AI
When evaluating a data analytics course that features AI, look beyond tool logos. Use this comprehensive evaluation checklist:
10. What's the Advantage of Taking a Data Analytics Course That Incorporates AI?
As AI becomes deeply embedded in modern business software, the role of the data analyst is evolving rapidly. While learning individual tools builds isolated technical knowledge, understanding the entire connected analytics workflow provides immense career leverage.
A modern, integrated course combines:
This holistic approach helps learners see how technologies connect in a real workflow: extracting data with SQL, wrangling it in Python, building dynamic visuals in Power BI, and leveraging AI tools for documentation, formulas, and query optimization.
11. Conclusion
A data analytics course that includes AI tools can help learners build practical data skills while getting comfortable with modern, AI-supported work processes. By studying Excel, SQL, Power BI, Python, data visualisation, and AI tools, students build an enduring foundation for working with business data.
Data analytics involves much more than producing figures or setting up dashboards; analysts must understand business questions, assess data quality, interpret results, communicate findings, and verify conclusions. Building new skills in this rapidly expanding field can strengthen your position in the job market and unlock exciting career opportunities.
Whether you are a college student, recent graduate, beginner, or working professional, learning data analytics with AI tools equips you with the technical, analytical, and practical skills required across modern enterprises.
Start Your AI-Powered Analytics Journey Today
Join the AcceleratorX Data Analytics Course to learn Excel, SQL, Power BI, Python, and AI analytics workflows from top industry mentors. Gain IBM co-certification and 1:1 career guidance.
Explore AcceleratorX Data Analytics Program