
AI AutoML Crash Course
Learn how to use Automated Machine Learning (AutoML) tools like Google AutoML, AutoKeras, H2O.ai, and Auto-Sklearn to build powerful models — even if you don’t know deep coding.
Discover how AI can automate your data analysis, speed up model building, and help you make smarter decisions at work.
⚠️ Note: This is a live-only session. No recordings will be shared.
What You’ll Learn
at a Glance
AutoML for Data Analysis
See how tools like Google AutoML, H2O.ai, Auto-Sklearn, and AutoKeras automatically clean data, test models, compare results, and suggest the best-performing approach — without heavy coding.
Build Models in Minutes
Learn how AutoML creates classification, regression, and prediction models quickly. Understand model accuracy, comparisons, and how to choose the best model for real use cases.
AI → Insights → Action
Discover how AutoML helps you: Predict outcomes, Spot patterns, Make data-backed decisions, Automate complex data tasks.
Why Attend This Workshop?
"AI won’t replace analysts — but AutoML will supercharge them."
Whether you're a beginner, a working professional, or someone planning a career switch, this crash course will help you:
- Understand how AutoML simplifies traditional data analysis.
- Build real machine learning models without deep programming.
- Automate repetitive analysis and speed up your workflow.
- Explain insights clearly to your team or clients.
Limited Spots. High Impact.
This is a practical, hands-on workshop where you’ll: ✔️ Work on real datasets ✔️ Build AutoML models live ✔️ See end-to-end workflows ✔️ Get direct learning from the mentor
Real Projects. Real Skills.
You won’t just watch — you’ll build: Automated ML pipelines, Auto-generated dashboards, Prediction models, Insight-driven reports. Perfect for anyone preparing for a data analytics career or upgrading their role with AI skills.

Meet Your Mentor

Akash Maurya
AI & Data Analytics Expert
Known for simplifying complex data concepts, Akash has helped 10,000+ learners transition into AI and analytics roles through practical, real-world training.
AI Data Analytics Ecosystem
Learn how AutoML connects with tools you already use — Google Sheets, Excel, Notion, PowerBI, ChatGPT, Slack — to build a smooth workflow from raw data to working ML models.

Airtable

ClickUp

Cursor

Gmail
HubSpot

Lovable

Notion
OpenAI

Replit
Google Sheets
Slack

Stripe

Trello

Windsurf
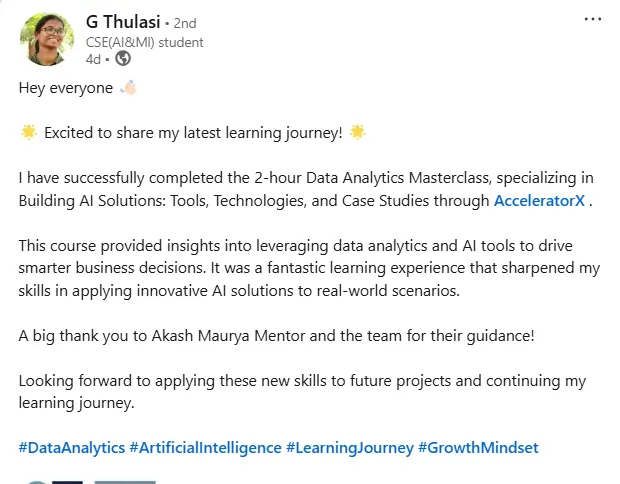
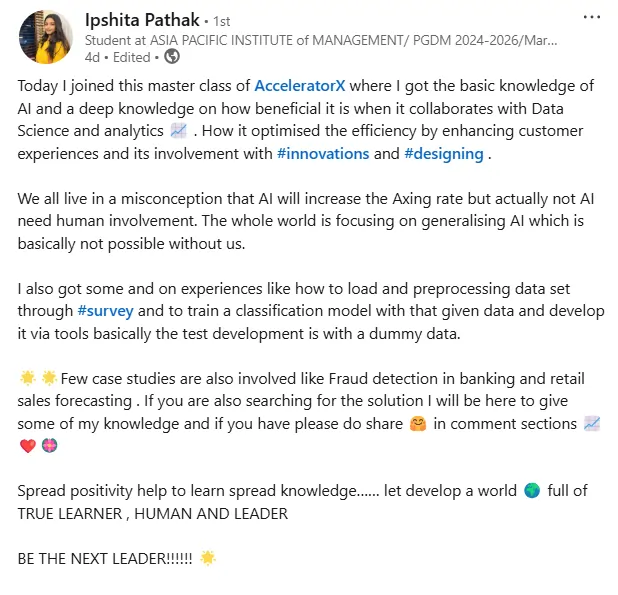
What Past Attendees Say




FAQs
Let’s build your first AutoML model — together.
Start learning how to automate data analysis and model building with AI, fast and effectively.